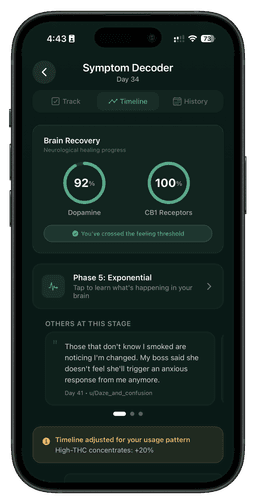
Most of what you read about cannabis withdrawal comes from clinical studies with a few dozen participants. This report comes from the other direction: the daily check-ins of 1,437 people who used the Klar app to quit weed between December 2025 and October 2026 and agreed to share their data anonymously. 5,960 daily check-ins, 3,501 symptom logs, 785 cravings and 631 slips, aggregated with a minimum group size and no personal data.
Every chart below can be reused under a CC BY 4.0 licence with a link to this page, and the numbers are in a downloadable dataset. The methodology section explains what the data can and cannot tell you.
Eight things the data says
- Day 3 is the hardest day. Average symptom severity peaks at 5.0 out of 10 on day 3 (58 people), then drifts down to 4.3 by day 9.
- Insomnia and vivid dreams outlast everything else. Irritability, cravings and appetite loss fade within two weeks; insomnia is still 5.0 and vivid dreams 5.1 in weeks 3 to 4.
- Cravings are an evening problem. 42% of logged cravings came between 18:00 and midnight, and 20:00 is the single peak hour. Evening cravings are also the most intense.
- Three in four cravings pass. Where people logged what happened next, 77% of cravings ended without using.
- Slips are the norm, not the exception. 69% of people who tracked at least a week logged at least one slip.
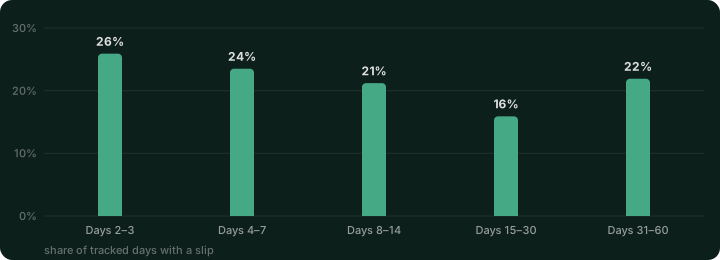
- The first slip comes early. The median first slip is on day 2; 70% of first slips happen within the first three days.
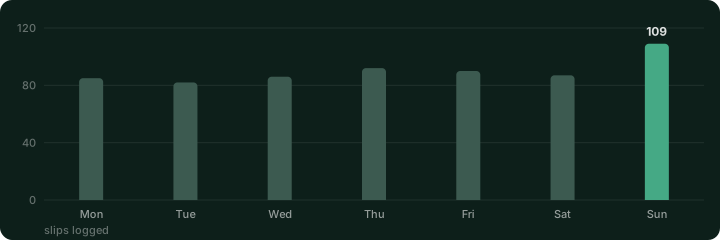
- Sunday is slip day. 109 slips fell on a Sunday, against 82 to 92 on every other weekday.
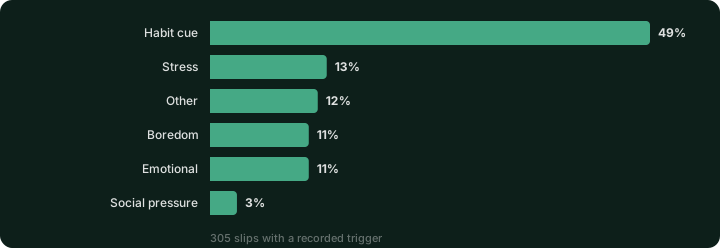
- Habit, not stress, is the main trigger. Half of all slips with a recorded trigger were cued by habit; stress accounts for 13%.
Who is quitting
The people behind the numbers are young and heavy users. Among those who completed the onboarding questions, the median age is 29 and 54% are between 25 and 34. The median person has used for 4 years (interquartile range 2 to 7), and 71% use several times a day. On Klar's dependency self-test, the median score is 71 out of 100. German is the largest language group (44%), followed by English (15%), Portuguese (12%), French (10%) and Spanish (6%).
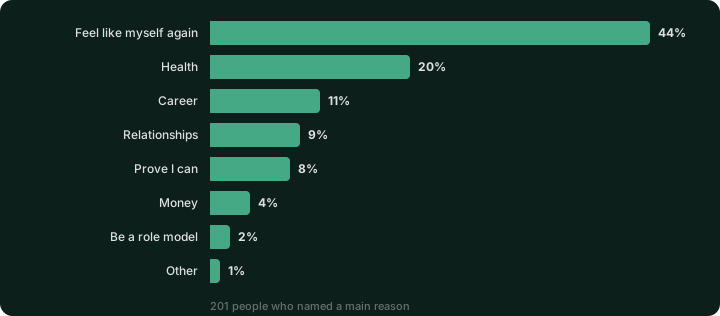
Asked for their main reason to quit, 44% chose "feel like myself again". Health comes second at 20%. Money, the reason most quit-smoking campaigns lead with, is named by 4%.
When they start, people rate their own expected withdrawal: 18% minimal, 35% mild, 23% moderate and 25% severe (231 people).

Which symptoms, and for how long
Klar asks for eight symptom scores in the daily check-in, each from 0 to 10. In the first week, 130 people logged an average of 5.3 for insomnia, irritability and cravings, 5.2 for anxiety, 5.0 for brain fog and vivid dreams, 4.7 for appetite loss and 4.4 for physical discomfort. The overall score for week 1 is 4.6.
By weeks 3 to 4 (39 people still logging) the overall score is 3.6. Appetite loss (3.0), physical discomfort (3.1) and brain fog (3.7) have faded most. Insomnia (5.0) and vivid dreams (5.1) have barely moved. That matches the sleep research: THC suppresses REM sleep, and the rebound when it is gone takes weeks to settle. See insomnia after quitting weed and vivid dreams after stopping weed for what helps.
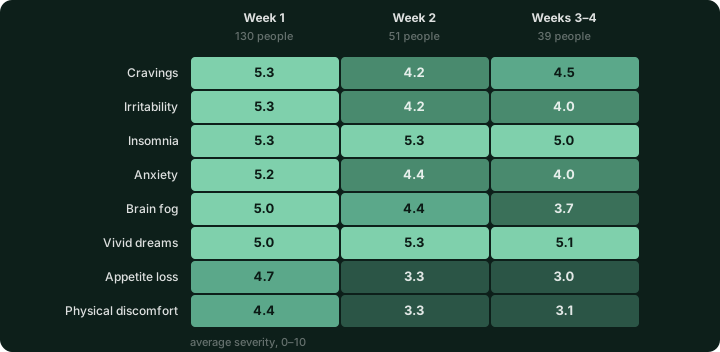
Table view
| Symptom | Week 1 (130) | Week 2 (51) | Weeks 3–4 (39) |
|---|---|---|---|
| Cravings | 5.3 | 4.2 | 4.5 |
| Irritability | 5.3 | 4.2 | 4.0 |
| Insomnia | 5.3 | 5.3 | 5.0 |
| Anxiety | 5.2 | 4.4 | 4.0 |
| Brain fog | 5.0 | 4.4 | 3.7 |
| Vivid dreams | 5.0 | 5.3 | 5.1 |
| Appetite loss | 4.7 | 3.3 | 3.0 |
| Physical discomfort | 4.4 | 3.3 | 3.1 |
| All symptoms | 4.6 | 4.1 | 3.6 |
The first nine days, day by day
Day-level averages are only shown where at least 34 people logged that day. Overall severity starts at 4.6 on day 1, peaks at 5.0 on day 3 and is down to 4.3 by day 9. Insomnia has two peaks: 6.1 on day 3 and 6.0 to 6.1 on days 8 and 9. Vivid dreams start low on day 1 (3.7), because REM rebound needs a few THC-free nights, and peak at 6.9 on day 4.
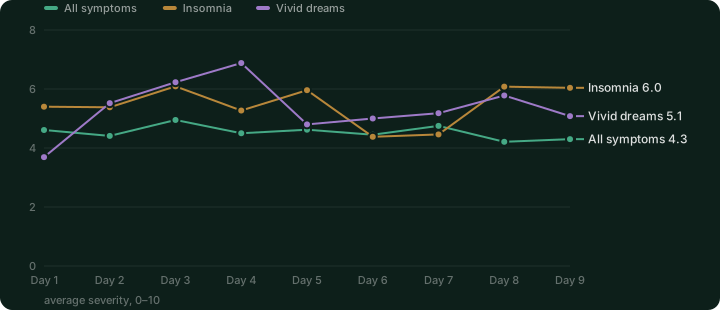
Table view
| Day | People | All symptoms | Insomnia | Vivid dreams | Cravings | Anxiety |
|---|---|---|---|---|---|---|
| 1 | 102 | 4.6 | 5.4 | 3.7 | 5.6 | 5.4 |
| 2 | 57 | 4.4 | 5.4 | 5.5 | 5.2 | 4.4 |
| 3 | 58 | 5.0 | 6.1 | 6.2 | 5.3 | 5.7 |
| 4 | 45 | 4.5 | 5.3 | 6.9 | 5.6 | 5.2 |
| 5 | 41 | 4.6 | 6.0 | 4.8 | 4.7 | 5.3 |
| 6 | 38 | 4.5 | 4.4 | 5.0 | 5.1 | 5.7 |
| 7 | 38 | 4.8 | 4.5 | 5.2 | 5.4 | 5.2 |
| 8 | 41 | 4.2 | 6.1 | 5.8 | 3.9 | 4.8 |
| 9 | 34 | 4.3 | 6.0 | 5.1 | 4.4 | 4.5 |
If you want this curve fitted to your own usage pattern, the withdrawal symptom calculator does exactly that, using the same dataset.
Try Klar free
Cannabis-specific symptom tracking, a 90-day recovery timeline, and CB1 brain-recovery visualization — built only for quitting weed. On iPhone and Android.
When cravings hit
140 people logged 785 cravings with a timestamp. The daily curve is unmistakable: almost nothing before 08:00, a first wave around 11:00, and a long climb through the afternoon to a peak at 20:00 (68 cravings). 42% of all cravings fall between 18:00 and midnight. Evening cravings are also stronger: 5.6 out of 10 on average, against 4.8 in the morning and afternoon.
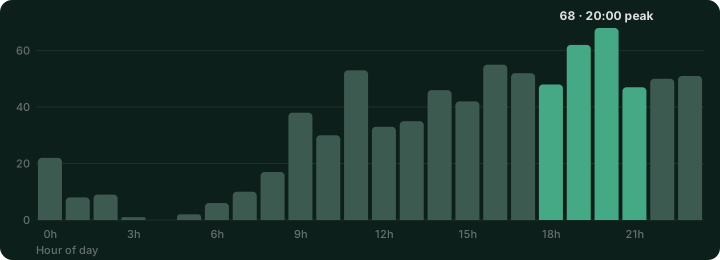
270 of those cravings have a logged outcome, and 77% of them passed without using. The pass rate is highest in the morning (81%) and lowest in the afternoon and evening (75%). The practical reading: a craving at 20:00 is both more likely and harder, so that is the hour to plan for. Craving surfing is the technique Klar teaches for exactly this moment.
Table view
| Time of day | Cravings | People | Avg. intensity | Passed (where logged) |
|---|---|---|---|---|
| Morning (06–11) | 154 | 65 | 4.8 | 81% (54 of 67) |
| Afternoon (12–17) | 263 | 84 | 4.8 | 75% (79 of 106) |
| Evening (18–23) | 326 | 93 | 5.6 | 75% (57 of 76) |
| Night (00–05) | 42 | 25 | 6.0 | 90% (19 of 21) |
Slips: when, how often, why
Klar treats a slip as data, not failure, and the data says that is the right frame. Of the 111 people who tracked at least seven days, 76 (69%) logged at least one slip. The median first slip came on day 2; 70% of first slips happened within the first three days and 86% within two weeks. Almost nobody slips for the first time after a month.
Per tracked day, the slip rate falls through the first month: 26% of tracked days on days 2 and 3 were slips, 24% on days 4 to 7, 21% on days 8 to 14 and 16% on days 15 to 30. It rises again to 22% on days 31 to 60, in a smaller group of 57 people. Day 1 is excluded because many people log their quit day itself as a slip.
Weekdays matter less than you would guess, with one exception. Monday to Saturday each carry 82 to 92 of the 631 slips; Sunday carries 109, about a fifth more than any other day.
305 slips have a recorded trigger. Half were cued by habit: the usual place, time or routine, with nothing in particular going wrong. Stress (13%), boredom (11%) and emotional states (11%) follow; social pressure is last at 3%. The lesson for the first week is to change the routine around the old cue, not to brace for a crisis that mostly does not come.
What this means if you are quitting
- Plan for day 3 and for 20:00. That is when severity and cravings peak. Have the evening of your first weekend scripted before it starts.
- Expect sleep and dreams to take weeks. Everything else improves within two weeks; sleep does not. Treat it as a known cost, not a sign that quitting is not working.
- Change the cue, not just the habit. Half of slips are habit-cued. The first week is the time to move the routine that used to end with a joint.
- A slip is a data point. Most people who quit log at least one, and most of those first slips happen in the first three days. The people who reach 30 days are mostly people who slipped and kept tracking.
The complete withdrawal guide covers what helps for each symptom, and the THC detox calculator estimates how long THC stays in your system. Klar itself is the app this data comes from.
Methodology and limits
Source. Klar app check-ins between 22 December 2025 and 26 October 2026, from the 1,437 profiles that opted in to anonymous data sharing in the app's settings. The aggregates were pulled read-only on 26 October 2026 and contain no user identifiers and no free-text fields.
Group sizes. A figure is published only when at least 30 people contributed to it (day-level series) or at least 50 events (craving and slip counts). Weekly symptom averages therefore stop at weeks 3 to 4 (39 people), and day-level averages at day 9 (34 people). Slip rates for days 61 and later are not shown because fewer than 30 people reached them while still tracking.
What the numbers are. Symptom scores are self-reported on a 0 to 10 scale in the daily check-in. A "slip" is a check-in marked as a use day. Craving timestamps use the device's local time. Dependency scores come from Klar's onboarding self-test, not a clinical instrument.
Limits. This is a convenience sample of app users who chose to track, skewed towards German speakers and heavy daily users; it is not a population estimate. Later-week averages describe the people who kept logging, who may differ from those who stopped. Nothing here is a causal claim or medical advice. The literature-based symptom ranges that Klar also uses are in the symptom guide.
Reuse. Charts and numbers are published under CC BY 4.0. Please cite as "Klar (liveklar.com), Cannabis Withdrawal Data Report 2026" with a link to this page. The dataset behind every chart: klar-cannabis-withdrawal-report-2026.json. Press and research enquiries: support@liveklar.com.